This function creates a time series plot of a specified variable from a weather station object. If no variable is specified, it will plot all time series variables in a grid layout.
Details
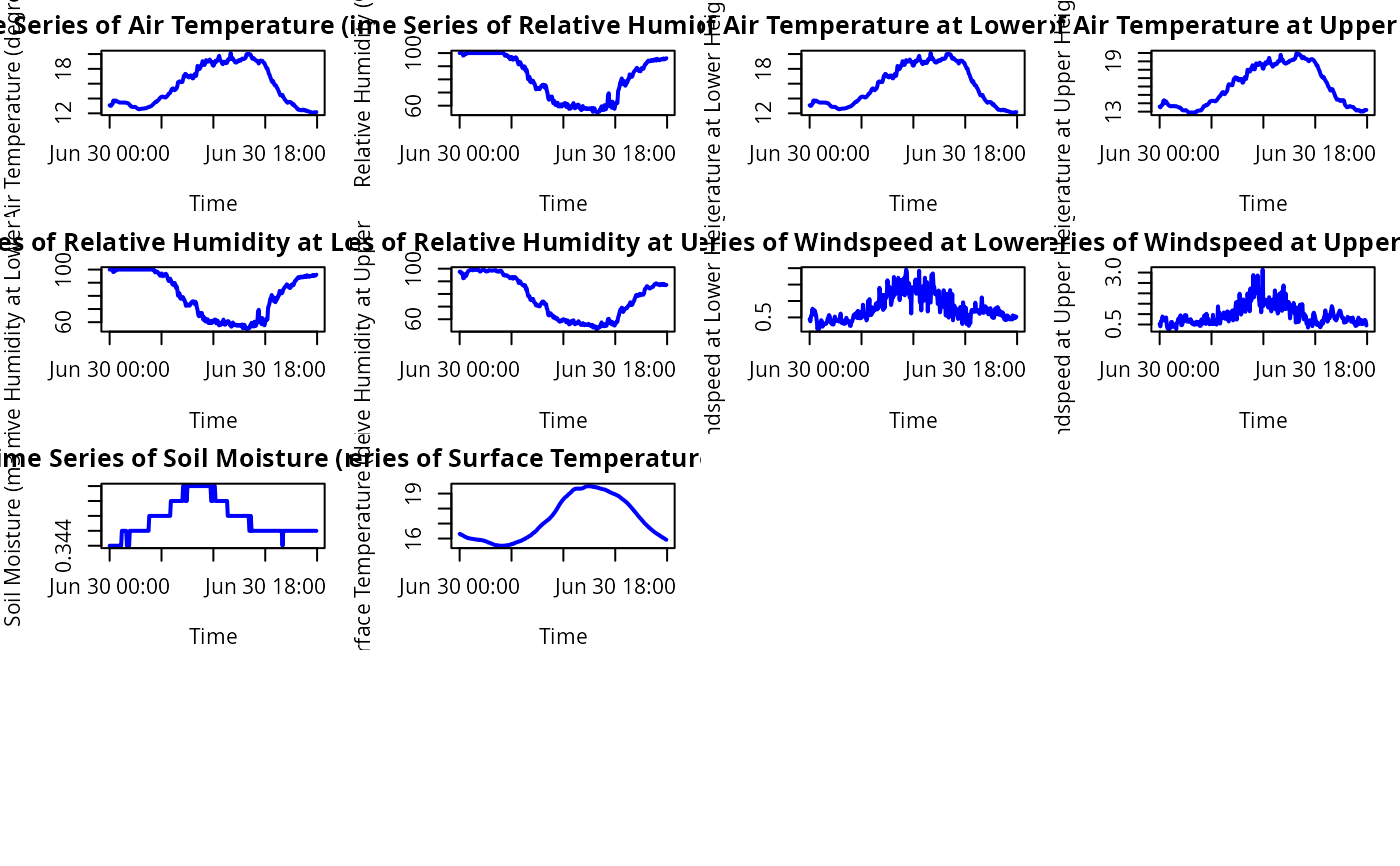
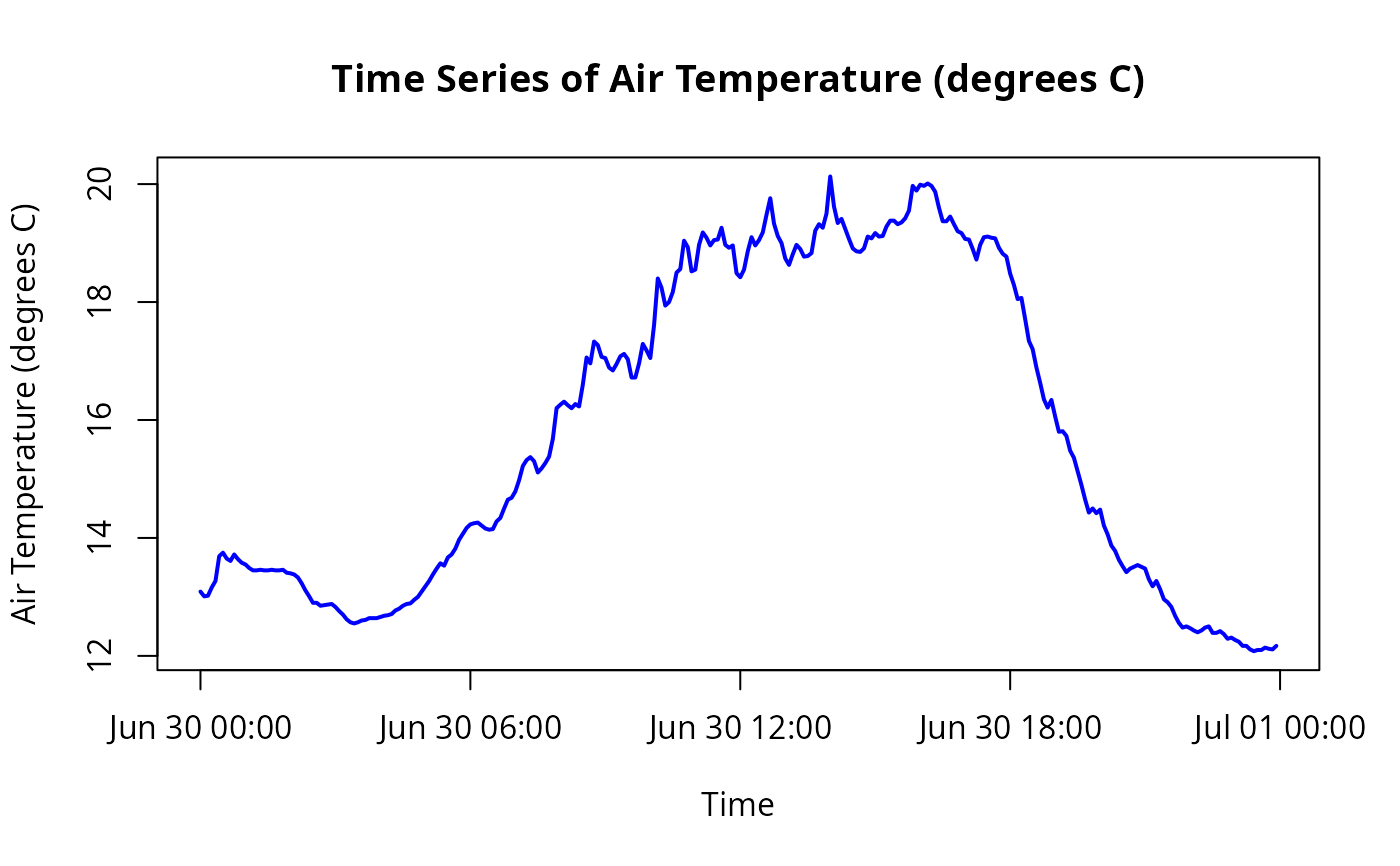
The plot_weather_station function generates a time series line plot for a specified variable within a weather station object. If no variable is specified, it plots all available time series variables in a grid layout. Non-time series variables, such as those with a single value or character data, are automatically excluded.
The function uses base R plotting functions to ensure minimal dependencies and simplicity in usage.
Examples
caldern_file <- system.file(
  "extdata",
  "caldern_wiese_2017-06-30.csv",
  package = "fieldClim"
)

caldern <- read.csv(
  caldern_file,
  na.strings = c("NULL", "NA", "")
)

caldern$datetime <- as.POSIXct(
  caldern$datetime,
  tz = "Europe/Berlin"
)

ws <- build_weather_station(
  # Time axis.
  datetime = caldern$datetime,

  # Station location.
  lon = 8.6832,
  lat = 50.8405,
  elev = 261,

  # Standard air temperature and relative humidity.
  temp = caldern$Ta_2m,
  rh = caldern$Huma_2m,

  # Profile variables for gradient- and stability-related methods.
  t1 = caldern$Ta_2m,
  t2 = caldern$Ta_10m,
  hum1 = caldern$Huma_2m,
  hum2 = caldern$Huma_10m,

  # Wind profile and measurement heights.
  v1 = caldern$Windspeed_2m,
  v2 = caldern$Windspeed_10m,
  z1 = 2,
  z2 = 10,

  # Package names for theoretical flux terms:
  # rad_bal corresponds to Q*, soil_flux corresponds to B.
  rad_bal = caldern$Q_star,
  soil_flux = caldern$B,

  # Additional surface and soil information.
  moisture = caldern$water_vol_soil,
  surface_temp = caldern$Ts,

  # Surface type as a model assumption.
  surface_type = "field",

  # Observation height for methods requiring a reference height.
  obs_height = 2
)

# Plot air temperature.
plot_weather_station(ws, "temp")


# Plot all available time series variables.
plot_weather_station(ws, NULL)
# Plot all available time series variables.
plot_weather_station(ws, NULL)